
The cost report works out what your applications cost and lets you group that figure whichever way you need it: per block, per product, per month, per crop. You build the table by choosing what goes down the side and what goes across the top, then take it away as a PDF or a spreadsheet.
Two things decide whether there is anything to see:
- Only confirmed applications count. An application still sitting in instruction has not taken anything out of the store yet, so it has no cost.
- Only priced receipts carry money. If nothing you received was captured with a price, everything comes out at R 0,00. See How chemical costs are worked out.
Your role has to be Administrator, Manager or Financial Officer. No other role may see costs.
Open it
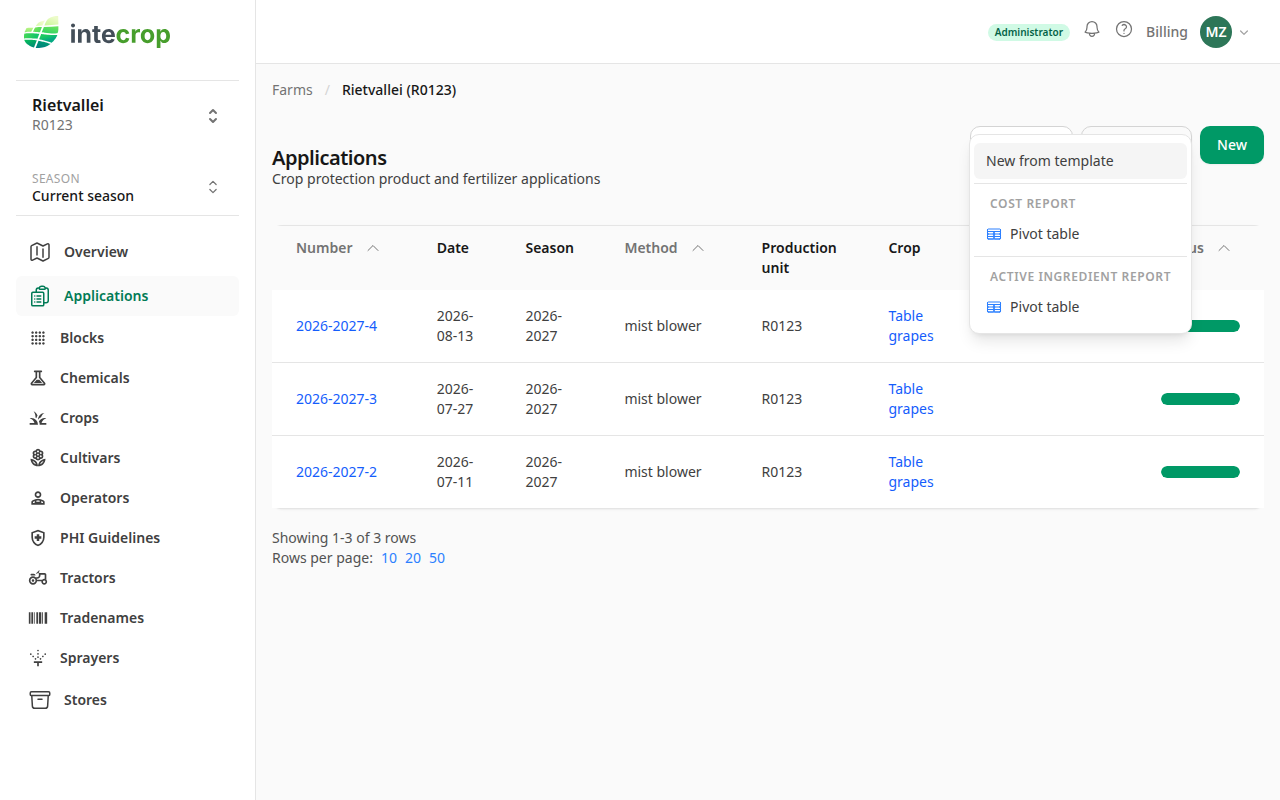
On the Applications page, open the Actions menu and choose Pivot table under Cost report.
The report opens with a period already filled in: your current season, from the day it started up to today. Everything below changes only what you are looking at — nothing here changes your records.
Ask what each block cost
That is the question the report opens on, so there is nothing to set up.
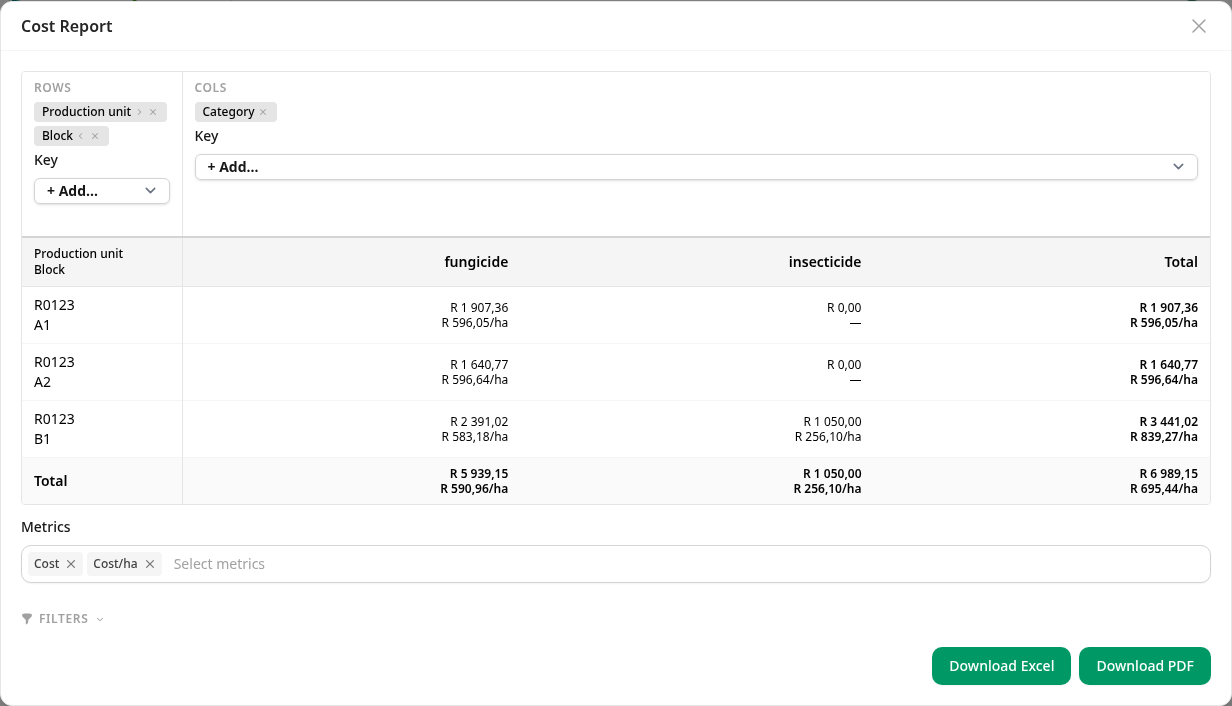
Down the side is Production unit and then Block; across the top is Category. Each cell shows two figures, the cost and the cost per hectare.
A row is one block's season. In the example, A1 and A2 come to about R 596/ha each and B1 to R 839,27/ha — B1 being the only block that also had an insecticide on it, the R 1 050,00 in the second column.
To change the grouping, use the + Add… boxes in the top-left (down the side) and top-right (across the top). Each dimension you add becomes a chip: the arrows move it in or out a level, the × takes it off again.
The table on screen is a preview. It shows at most three rows and three columns, and marks the rest with ⋯ and ⋮. On a farm with forty blocks you will see three of them here. The PDF and the spreadsheet carry everything.
Ask what each product cost
Take Production unit and Block off the side and add Product. Across the top, swap Category for Month. Then click the Metrics box: add Product applied and Unit cost, and click Cost/ha to take it off again. One click in that list adds an entry, a second one removes it.
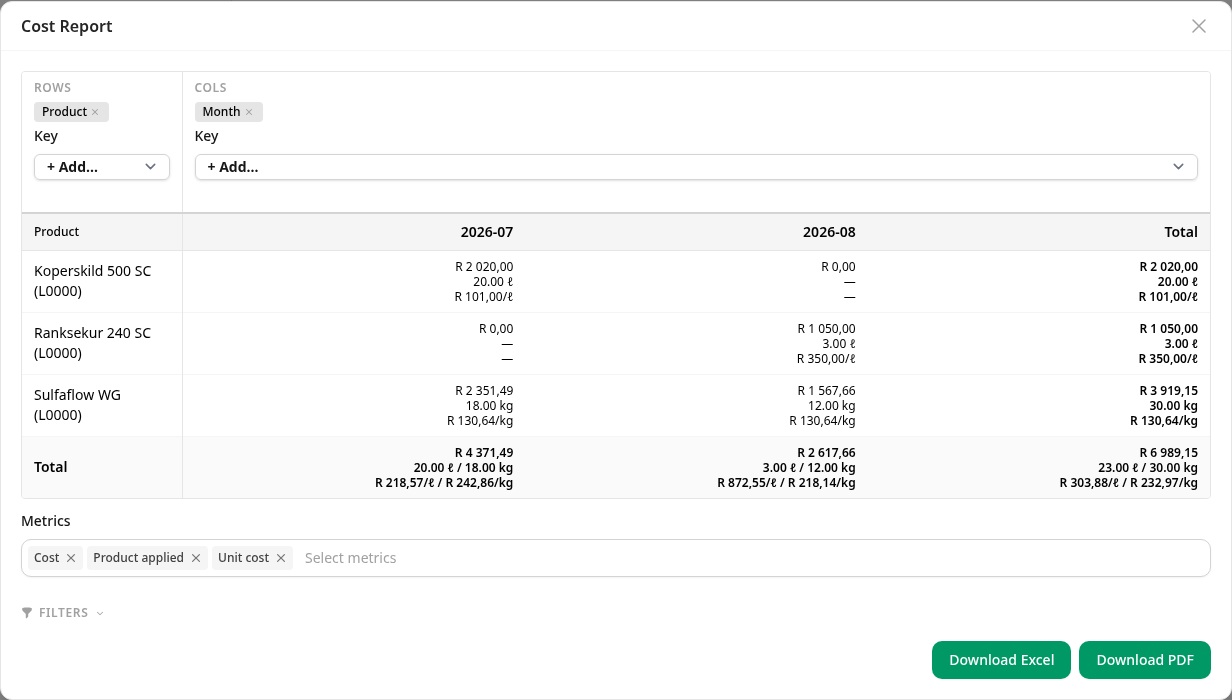
Now each cell carries three lines: what you spent, how much product that was, and what it worked out to per kilogram or per litre. Sulfaflow WG comes to R 3 919,15 for the season, 30 kg of it, at R 130,64/kg.
Two things to know about the unit cost:
- It is only offered when Product is one of the row dimensions. Anywhere else a row would mix products, and a rand-per-kilogram across two different products means nothing.
- On the Total row it prints one figure per unit —
R 303,88/LandR 232,97/kg. Those are the whole cost divided by each unit's quantity, not a price. Read the unit cost off a product's own row.
Narrow it down, or widen it out
Click Filters under the table. The panel holds the period and the filters together, because they do the same job: they decide which applications the figures are worked out from.
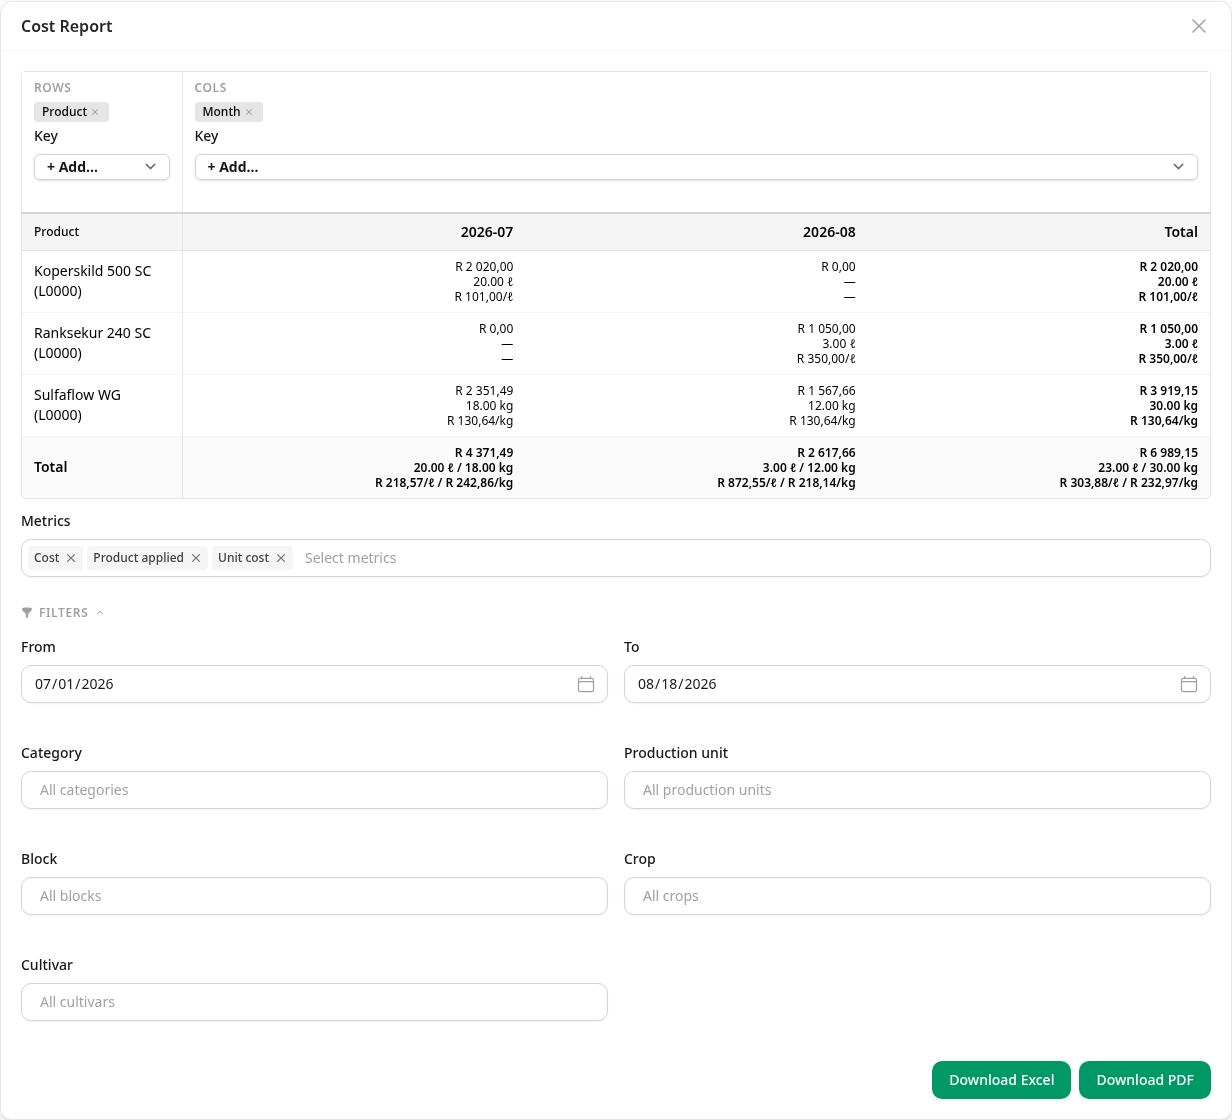
From and To take any two dates. The rest narrow by category, production unit, block, crop or cultivar, and you can pick more than one of each. The Block list holds the blocks this report has figures for, not every block on the farm — change the period and the list follows it.
Widen From back past the start of the season and last season's applications join the report — another month appears across the top, and Sulfaflow WG's unit cost moves from R 130,64/kg to R 130,00/kg.
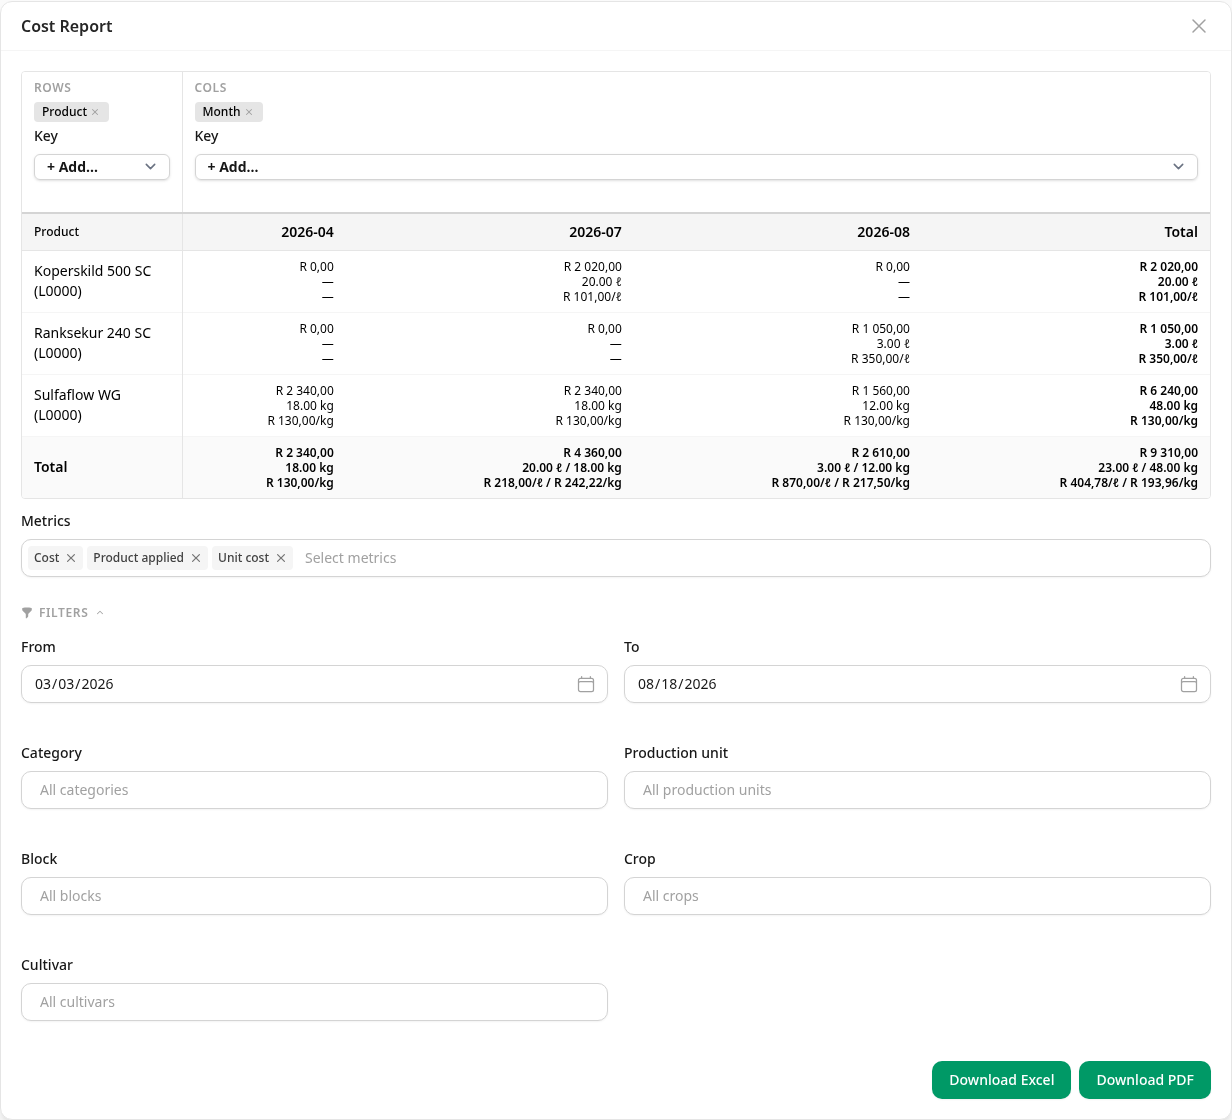
That drop is not a rounding error and neither figure is wrong. The cost per unit is an average worked out over the period you asked for, so a different period is a different average — which is why every export prints the period on it. How chemical costs are worked out explains what goes into that average.
Take it away
Two buttons at the bottom of the report:
- Download PDF — the table exactly as you built it, with every row and column, and the period and filters printed on it. This is the one to send to someone.
- Download Excel — one flat sheet named Data, a row per figure, with each dimension in its own column. It is not a pivot table; it is what you build your own pivot on, so it ignores the rows and columns you chose here and gives you the lot.
Both open in a new tab and both are named for the farm and today's date.
When there is nothing to see
- "No data found for the selected filters." Nothing confirmed falls in the period, or a filter has excluded everything. Widen the period first.
- Everything costs R 0,00. The applications are there but the money is not: the chemical has no receipt with a price on it, in the period or before it. Put the prices on the receipts and run the report again — nothing needs to be recaptured, because no cost is ever stored.